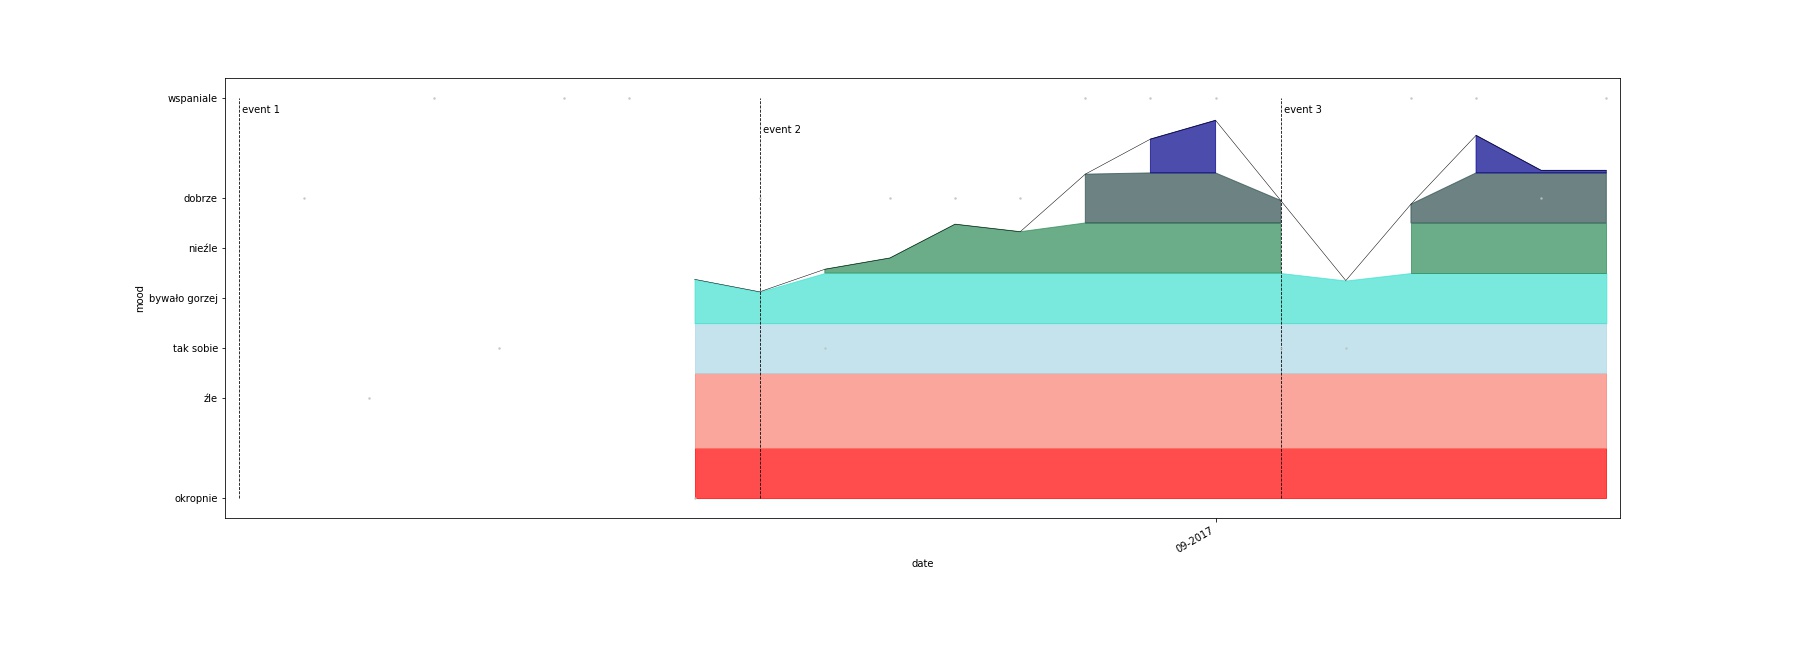
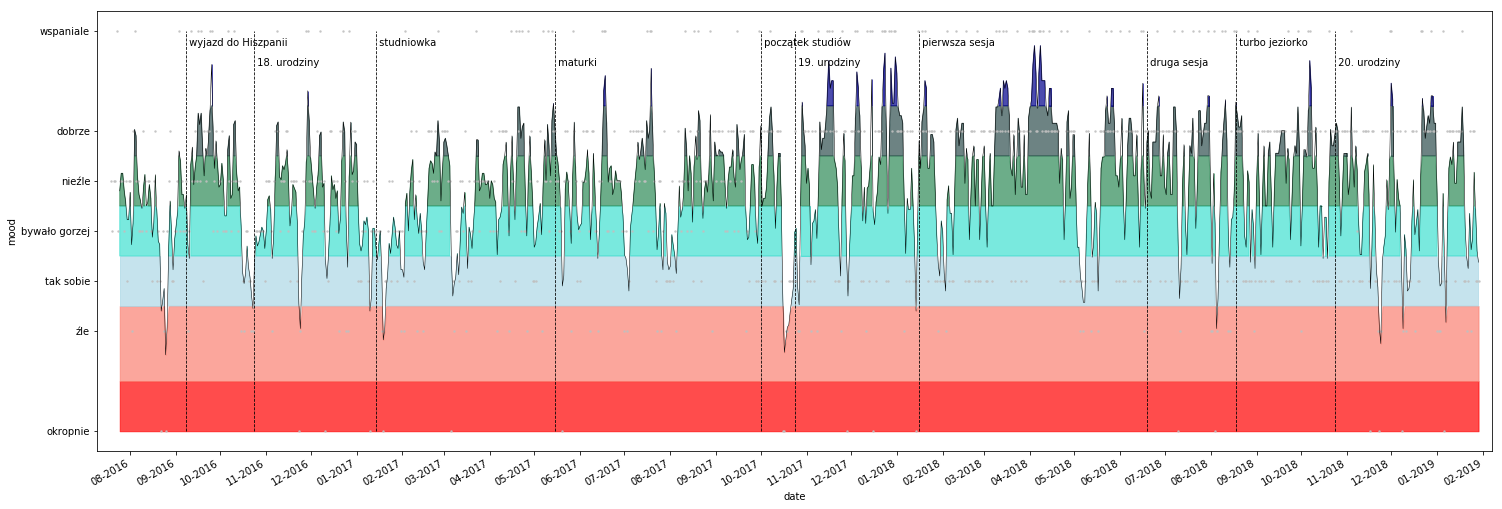
Jupyter Notebook for creating a plot of moods throught time.
Required format: <mood description>,<mood value>,<lower limit value>,<upper limit value>,<color name>
- mood description is an ordinary string,
- mood, lower limit and upper limit values are float values with dot as a decimal separator (e.g. 2.5)
- color name must be recognized by matplotlib
Required format: <date>,<event description>
- date must be in format YYYY-MM-DD
- only supports a single entry per day
- only supports Polish and English